參考來源
https://github.com/Supporterino/truenas-graphite-to-prometheus
Turenas app 建構 graphite-to-prometheus
參照 https://github.com/Supporterino/truenas-graphite-to-prometheus/blob/main/TRUENAS.md
Truenas web > Apps > Discover App > Custom App
Application Name:
graphite-exporter
Image repository
ghcr.io/supporterino/truenas-graphite-to-prometheus
其他保持預設
轉道 Port Forwarding
Container Port 與 Node Port
9109 9109
9108 9108
都是預設 TCP Protocol
9109用於 Graphite
9108用於 Prometheus
docker 裡已預先定義好 graphite_mapping.conf
|
|
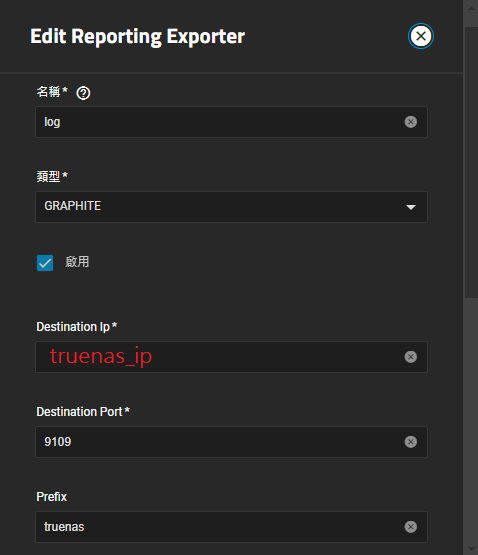
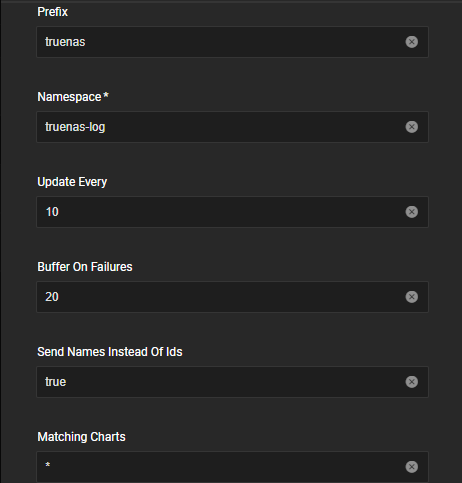
Truenas 匯出報告
web > report(報告) > 右上角 exporters
The prefix for the graphite metrics need to be set to truenas
這邊要注意 prefix 必須為 truenas
prometheus 匯入 truenas report
prometheus.yml 增加以下設定
|
|
位置為truenas 區網ip:9108
|
|
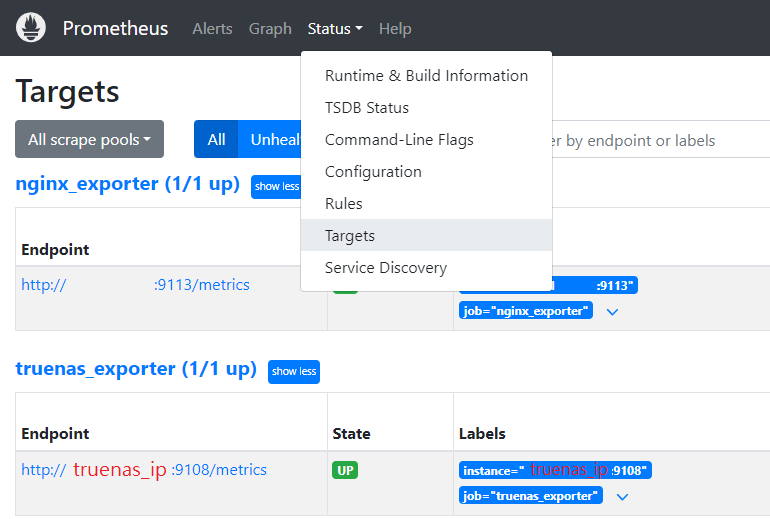 有看到 truenas_exporter (1/1 up) 綠燈表示開始收集資訊了
Grafana
Grafana > Home > Connections >Data sources >Add data source > prometheus
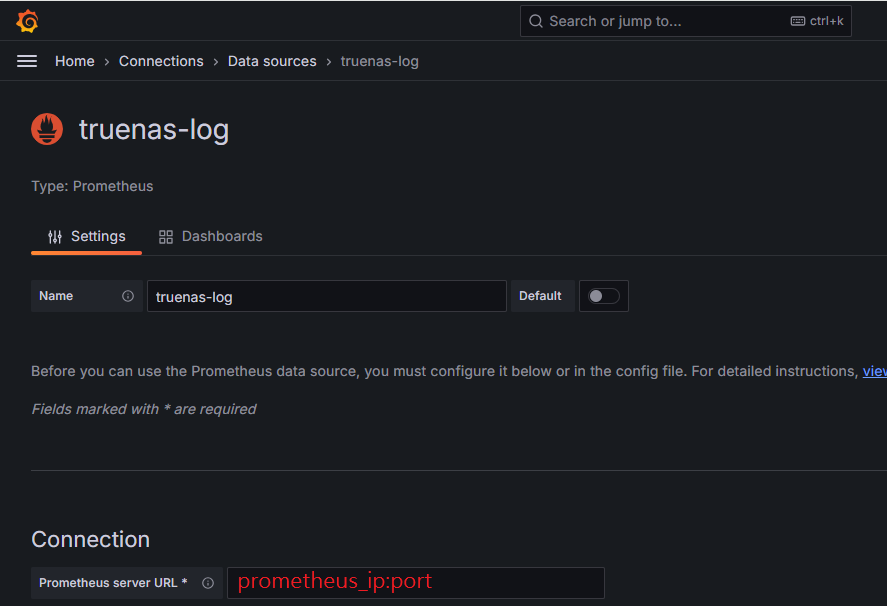
如共用 prometheus
拉到最下面 other 選項
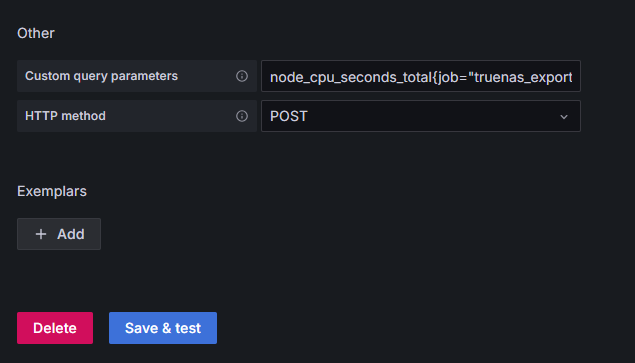
自訂查詢
|
|
save&test 綠燈 表 測試OK 剩最後一步囉~
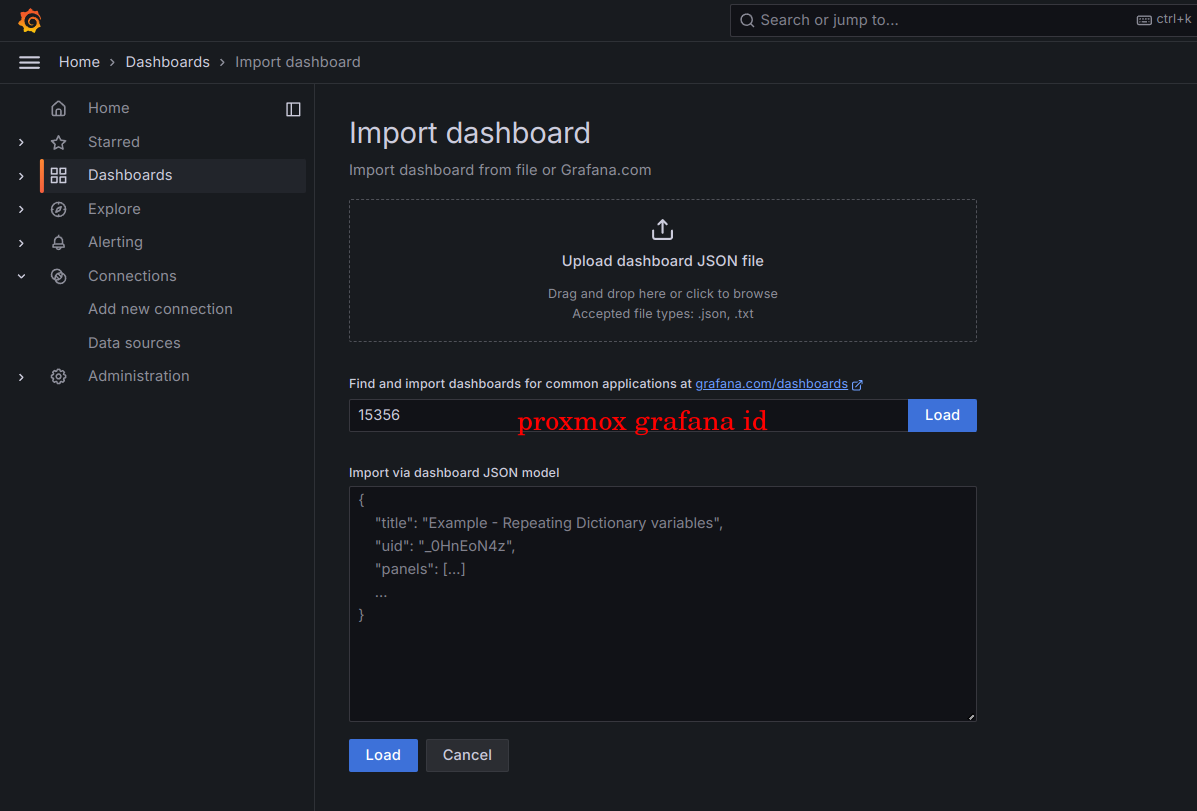
Dashboards(儀錶板) > NEW(右上新增選項) > Import dashboard (右下)
一次新增一個json文件,共新增三個面板
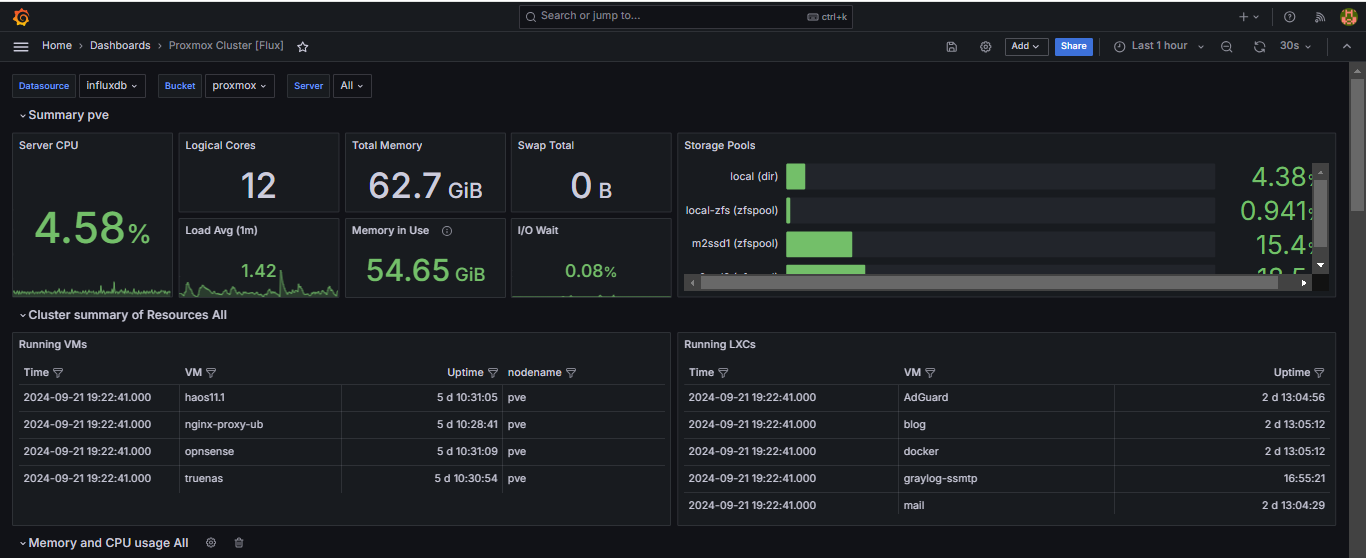
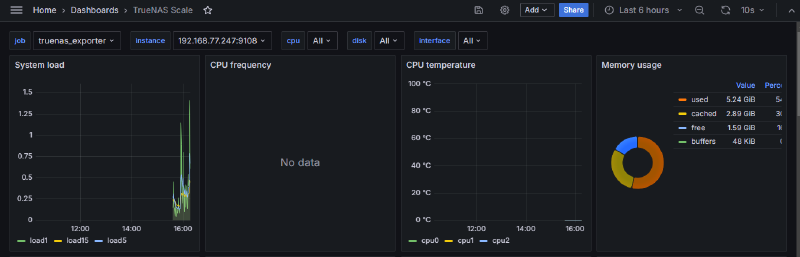
主面板
|
|
硬碟資訊
|
|
溫度
|
|
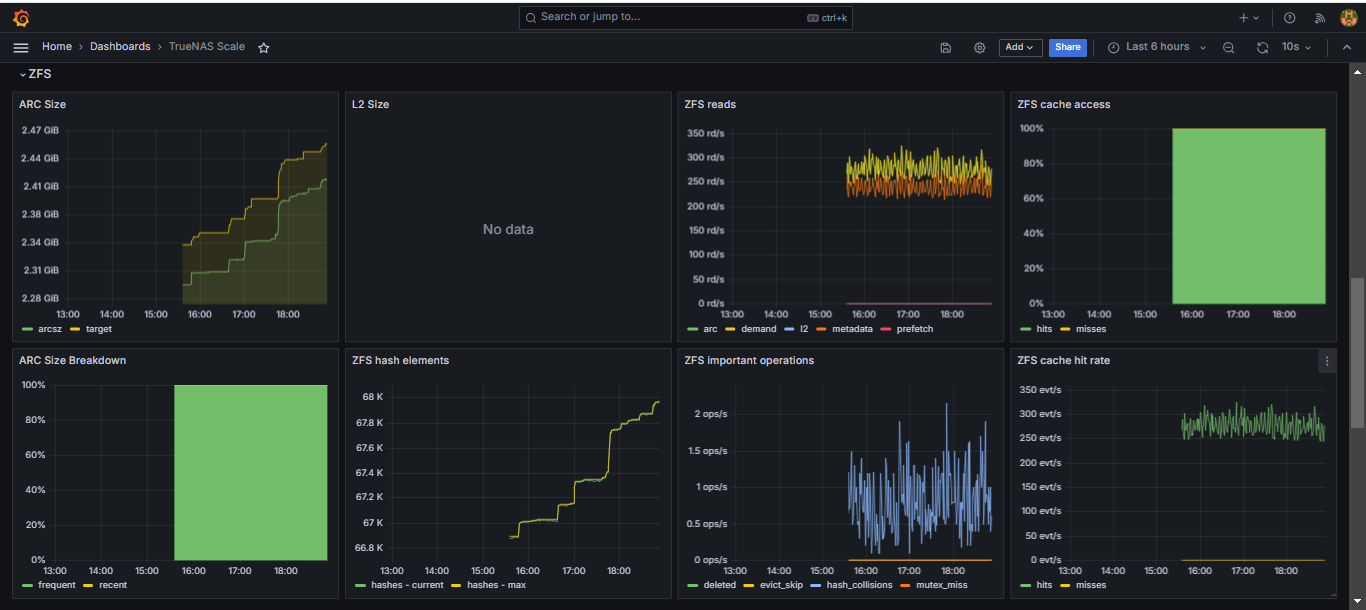
閱讀資訊的便利比 truenas web 好多了,感謝 cucac 大的研究精神 https://github.com/cucac
Proxmox Influxdb Grafana 監控方案
Mudium: https://medium.com/@nykogabriel/how-to-monitor-proxmox-with-grafana-and-influxdb-e55116081867